Table of Contents
- How Peptide Impurities Derail Experimental Results
- Peptide Batch Consistency for Research: Why It Matters More Than Purity Numbers
- How to Interpret Peptide Mass Spectrometry Results
- The Impact of Peptide Impurities on Cell Viability
- Defining Peptide Purity Levels: 95% vs 99% and What They Mean for Your Assay
- Storage, Handling, and Aggregation: Protecting Peptide Integrity
- Conclusion
- Frequently Asked Questions
Last Updated: September 19, 2026
How Peptide Impurities Derail Experimental Results
When an experiment fails for no obvious reason, the peptide itself is often the last thing anyone suspects. Low purity peptides introduce variables you never controlled for, and those variables show up as noise in your results. Understanding why low purity peptides cause experiment failure starts with knowing what is actually in the vial.
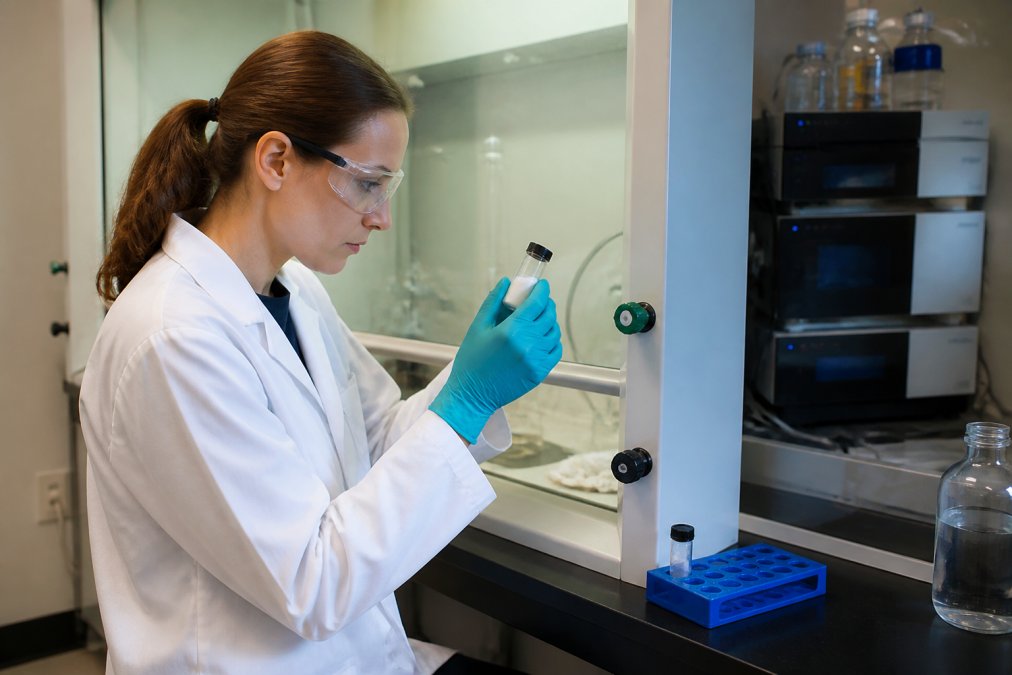
Peptide impurities fall into two broad categories: synthesis-related by-products and handling-related degradation products.
Common Impurities in Synthetic Peptides
Solid-phase peptide synthesis rarely produces a single clean product. The most common impurities include:
- Sequence truncation products from incomplete coupling reactions
- Deletion and insertion analogs with one or more missing or extra residues
- Residual solvents and scavengers left over from cleavage
- Heavy metal contamination from catalysts or equipment
- TFA salts from trifluoroacetic acid cleavage and purification
Each of these can interfere with your assay in different ways, and a certificate of analysis that reports only a single purity number will not tell you which ones are present.
The Impact of Endotoxin Contamination on Assays
Endotoxin contamination, primarily from lipopolysaccharides, is one of the most damaging impurities for cell-based work. Even trace amounts can trigger inflammatory signaling in cultured cells, skewing results in immunological assays and producing false positives or false negatives depending on what you are measuring. For in-vitro studies, endotoxin testing should be a baseline expectation, not an add-on. Purity by HPLC alone does not detect endotoxin, which is why a 98% pure peptide can still ruin a cell viability experiment.
Peptide Batch Consistency for Research: Why It Matters More Than Purity Numbers
A single high purity number tells you almost nothing about whether your next order will behave the same way. Peptide batch consistency for research is the real variable that determines whether your results replicate across an 18-month study. Two batches can both report 98% purity by analytical HPLC and still differ in by-product profile, salt form, and aggregation state. That difference is enough to shift a dose-response curve.
The practical implication: ask for batch-specific Certificates of Analysis, not a representative COA from a previous lot. At Minuteman Peptides, every batch is tested independently by an ISO/IEC 17025 certified third-party laboratory and verified by both HPLC and mass spectrometry, so the data you receive reflects the material in your hands.
| Consistency Factor | Why It Matters | What to Verify |
|---|---|---|
| By-product profile | Alters assay background | Batch-specific HPLC trace |
| Salt form | Changes solubility and mass | Mass spec confirmation |
| Endotoxin level | Triggers cell signaling | Endotoxin testing report |
| Aggregation state | Reduces effective concentration | Fresh reconstitution data |
How to Interpret Peptide Mass Spectrometry Results
Mass spectrometry confirms identity; it does not confirm purity. The observed mass should match the theoretical mass of your intended sequence within the instrument’s tolerance. A single dominant peak at the correct mass is a good sign. What most researchers miss is that mass spec will happily confirm the correct molecule while ignoring a large population of truncated sequences that happen to co-elute.
Read the spectrum alongside the HPLC trace, not in isolation. If the HPLC shows a broad or split peak, the mass spec result is less reassuring than it looks. For a deeper explanation of how these methods complement each other, the FDA guidance on analytical procedures and methods validation outlines the validation principles that apply to both.
The Impact of Peptide Impurities on Cell Viability
The impact of peptide impurities on cell viability is often indirect and easy to misattribute. Residual TFA, heavy metals, and endotoxin can all reduce viability independent of your peptide’s intended biological activity. When a treatment group shows reduced cell numbers, the temptation is to conclude the peptide is cytotoxic. More often, the impurity is.
A common mistake is running viability assays without an untreated vehicle control that accounts for the reconstitution buffer. If your peptide was reconstituted in a solvent that itself affects cells, you cannot separate the effect of the peptide from the effect of the vehicle.
Never assume a purity percentage covers biological contaminants. HPLC purity and endotoxin levels are separate measurements, and a peptide can pass one while failing the other.
Defining Peptide Purity Levels: 95% vs 99% and What They Mean for Your Assay
Purity levels are reported as the percentage of the total peak area attributable to the target peptide. A 95% pure peptide may contain up to 5% impurities by area, which for a sensitive assay can be the difference between a clean signal and unusable data. A 99% pure peptide narrows that window considerably.
The cost-benefit calculation depends on your assay’s sensitivity, not on a blanket rule. Screening work with strong readouts often tolerates 95%. Quantitative studies, receptor-binding assays, and anything involving primary cells generally justify the higher grade. The NIH guidelines on rigor and reproducibility in research emphasize that reagent characterization is part of experimental rigor, not an optional refinement.
A decision framework for purity grade selection
Use the matrix below to match purity grade to assay type. It is a starting point, not a substitute for your own validation.
| Assay type | Recommended minimum purity | Why |
|---|---|---|
| Qualitative screening, strong readout | 95% | Impurity signal is small relative to the effect size |
| Standard ELISA, colorimetric | 95-98% | Cross-reactivity risk rises with truncation products |
| Quantitative dose-response, IC50/EC50 | 98%+ | Impurity shifts curve position and slope |
| Receptor-binding assays | 99%+ | Truncated analogs compete for the same site |
| Primary cell culture, immunology | 99%+ with endotoxin testing | Biological contaminants dominate at low purity |
| In vivo work | 99%+ with full COA and endotoxin report | Regulatory and safety expectations are higher |
| Structural studies (NMR, crystallography) | 99%+ | Minor species obscure or distort structure |
When 95% is genuinely sufficient
If your readout is a large, robust effect, for example, a clear phenotypic change in a cell line that responds strongly to the peptide, the 5% impurity window is usually smaller than your assay noise. In those cases, spending the premium for 99% buys you little. The money is better spent on a second biological replicate.
When 99%+ is mandatory
Three situations justify the higher grade without debate. First, any assay where the impurity can mimic the target’s activity, such as receptor-binding or enzyme-kinetic work with truncated analogs. Second, any work with primary cells or immune cells, where endotoxin and residual TFA dominate the response. Third, any study intended for regulatory submission or publication in a journal that requires reagent characterization. In these cases, the cost of a failed experiment exceeds the cost difference between grades by a wide margin.
What the purity number does not tell you
Two peptides can both report 98% by HPLC and behave completely differently. The number does not tell you the identity of the 2%, the salt form, the endotoxin level, or the aggregation state. For any quantitative work, request the full HPLC trace and the mass spectrum alongside the summary figure. The shape of the trace, broad, split, or tailing peaks, often reveals problems that the aggregate percentage conceals.
For metabolic pathway work, request the full HPLC trace rather than the summary purity figure. The shape of the trace often reveals aggregation or truncation that a single number hides.
Do not treat a 99% purity figure as a substitute for endotoxin testing. They measure different things, and a peptide can pass one while failing the other.
Storage, Handling, and Aggregation: Protecting Peptide Integrity
Even a high-purity peptide degrades if it is stored or handled poorly. Lyophilized peptides are generally stable when kept dry and cold, but reconstitution starts a clock. Aggregation kinetics vary by sequence, and aggregated peptide effectively reduces the concentration available for your assay.
Best practices for protecting peptide integrity:
- Store lyophilized powder desiccated at the recommended temperature
- Aliquot before reconstitution to avoid repeated freeze-thaw cycles
- Reconstitute in the appropriate solvent for your peptide’s solubility and isoelectric point
- Check for visible particulates before running the assay
- Use freshly reconstituted material for quantitative work
Peptide degradation and aggregation are not always visible.
Conclusion
Experiment failure traced to peptide quality is preventable, but only if you treat purity, consistency, and handling as a single system rather than separate checkboxes. The researchers who get reproducible data are the ones who read beyond the purity number and demand batch-specific verification. Minuteman Peptides supports that standard with cGMP-certified US-based manufacturing, independent ISO/IEC 17025 certified third-party testing, and transparent Certificates of Analysis backed by verified HPLC and mass spectrometry results.
Frequently Asked Questions
Is 98% purity good for a peptide?
98% purity is adequate for many general screening assays but often insufficient for sensitive biological work. The remaining 2% can include truncated sequences, deletion peptides, and residual solvents that interfere with cell-based assays. For metabolic pathway research or signaling studies, 95% purity may introduce enough variability to obscure real effects. Always match purity grade to your assay sensitivity and request full impurity profiling.
What are the common contaminants found in low-purity synthetic peptides?
Low-purity peptides typically contain sequence truncation products, deletion peptides, residual trifluoroacetic acid (TFA), scavengers, and residual solvents from synthesis. Endotoxin contamination from non-GMP production environments adds lipopolysaccharides that trigger immune responses in cell culture. Heavy metal contamination can also occur. Each contaminant affects assays differently, which is why analytical HPLC and mass spectrometry verification matter more than a single purity percentage.
How does peptide aggregation lead to inconsistent experimental data?
Aggregation occurs when peptide molecules self-associate into larger structures, reducing the effective concentration of active monomer. This process depends on solubility, isoelectric point, and storage conditions. Aggregated peptides may show reduced activity in one experiment and normal activity in another, depending on reconstitution technique and time since preparation. Aggregation kinetics vary by sequence, making reproducibility across batches difficult without consistent handling protocols.
What standards should researchers use to verify peptide quality?
Look for cGMP-certified manufacturing, independent ISO/IEC 17025 certified third-party testing, and batch-specific Certificates of Analysis showing analytical HPLC and mass spectrometry results. Mass spectrometry confirms molecular weight and detects sequence truncation. HPLC reveals impurity profiles. For endotoxin-sensitive work, request lipopolysaccharides testing. Batch consistency documentation over multiple lots provides the strongest evidence that your supplier maintains reproducible synthesis and purification.